3QFY2018 Result Update | Logistics
January 24, 2018
Navkar Corporation
BUY
CMP
`193
Performance Update
Target Price
`265
Y/E March (` cr)
Investment Period
-
3QFY18
3QFY17
% yoy
2QFY18
% qoq
Net sales
106
92
16.2
108
(1.2)
EBITDA
38
33
12.8
40
(7.0)
Stock Info
EBITDA margin (%)
35.3
36.4
(107)
37.5
(218)
Sector
Logistics
Adjusted PAT
23
19
20.7
25
(5.4)
Market Cap (Rs cr)
2,910
Source: Company, Angel Research
Net Debt
161
Navkar Corporation (Navkar) reported a good set of numbers for 3QFY2018.
Beta
0.6
52 Week High / Low
247 / 155
The consolidated top-line grew by ~16% yoy. On the operating front, the
Avg. Daily Volume
99,509
company reported a margin contraction on account of sharp increase in
Face Value (Rs)
10
operating expenses. However, the net profit grew by ~21% yoy due to higher
BSE Sensex
36,162
Nifty
11,086
sales and lower interest cost.
Reuters Code
NA
Top-line grew ~16% yoy: The consolidated top-line grew by 16% yoy to ~`106cr
Bloomberg Code
NACO@IN
led by higher volumes and improvement. This quarter we saw some volume
improvement from Vapi logistic.
Shareholding Pattern (%)
PAT grew ~21% yoy: On the operating front, the company reported a margin
Promoters
69.0
contraction of 107bp yoy to 35.3% on account of sharp increase in other
MF / Banks / Indian Fls
16.9
operating expenses by 233bp yoy to 56.3% of sales. As a result, the EBITDA grew
FII / NRIs / OCBs
8.7
lower by 13% yoy to `38cr. Aided by better sales performance and lower interest
Indian Public / Others
5.4
cost, the net profit grew by ~21% yoy to ~`23cr
Outlook and Valuation: Going forward, we expect Navkar’s utilizations to
Abs. (%)
3m 1yr 3yr
improve; we expect the company to be able to garner a good chunk of business
Sensex
11.2
33.3
23.4
over the next 2-3 due to its rail advantage at both JNPT and Vapi. We maintain
NCL
(2.1)
12.7
NA
our Buy recommendation on the stock with a target price of `265.
Key Financials
Y/E March (` cr)
FY2015 FY2016
FY2017 FY2018E FY2019E
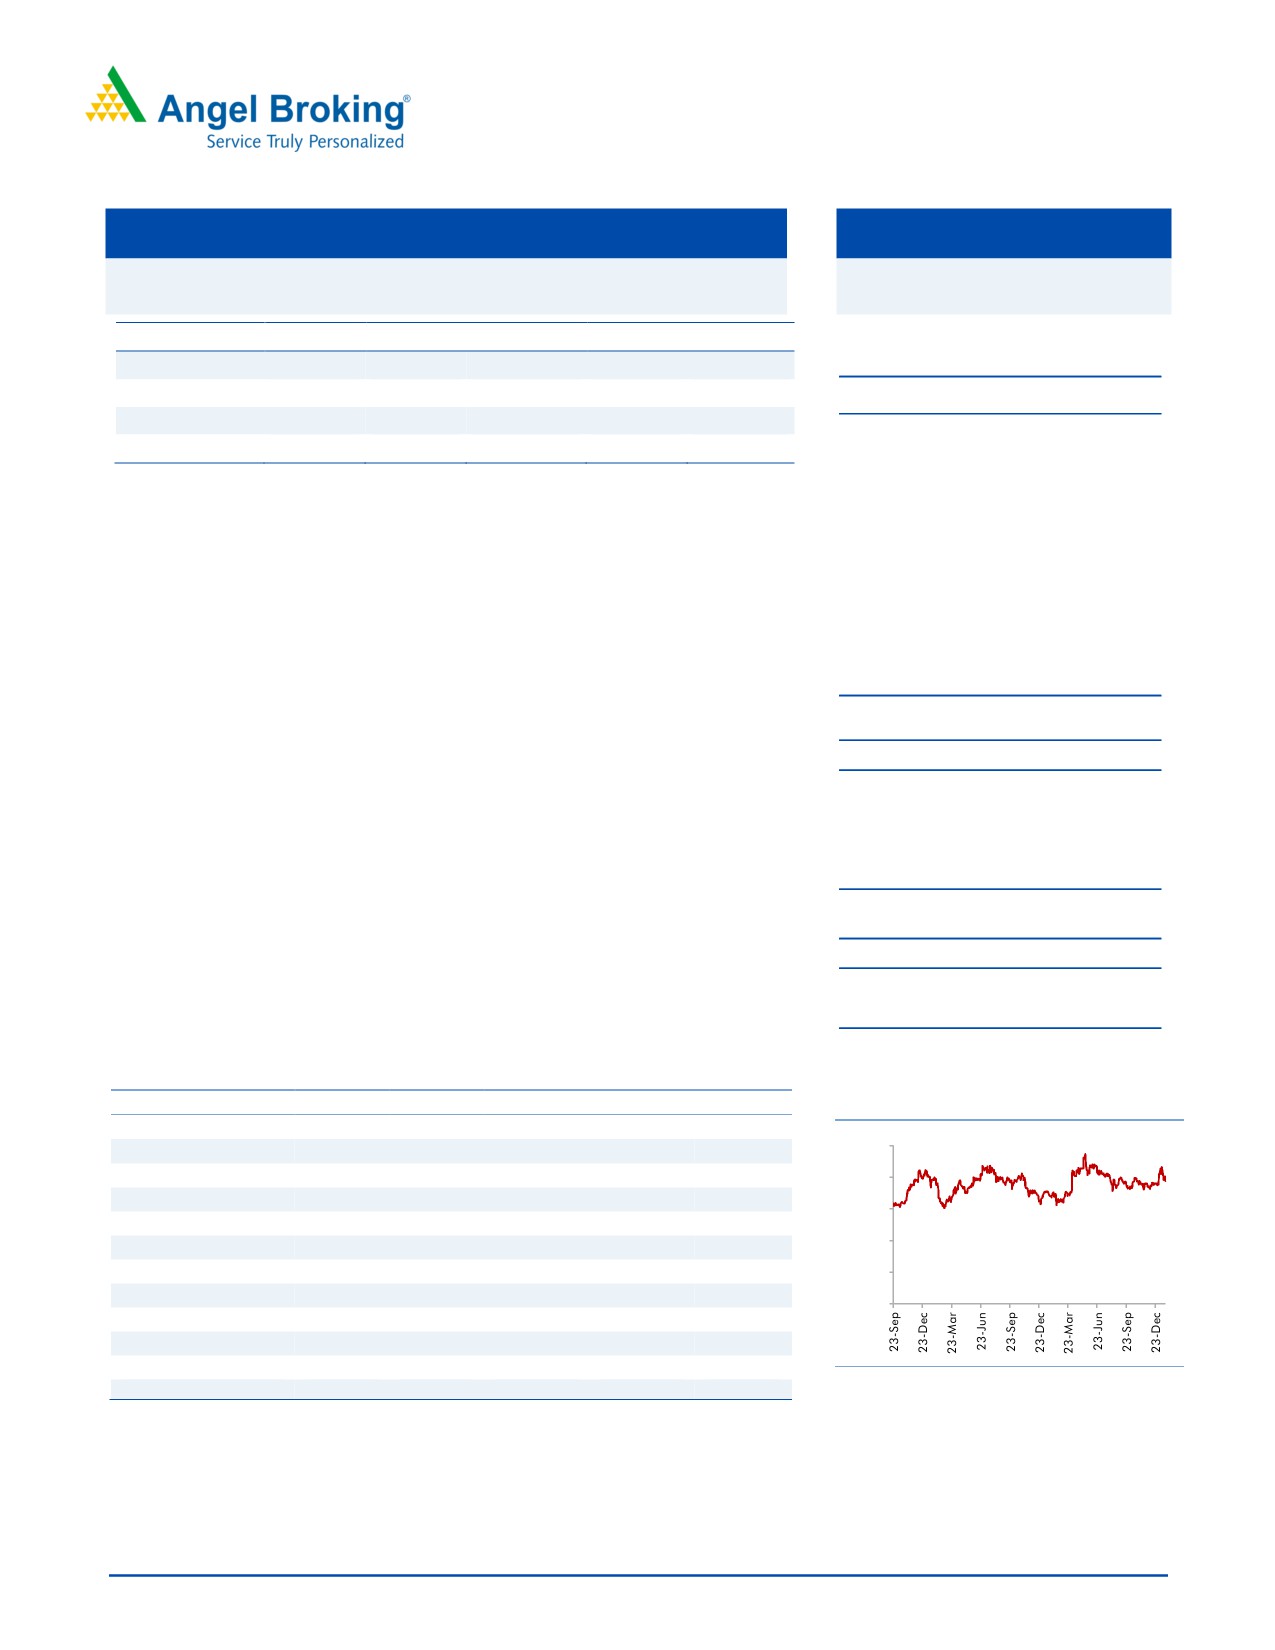
Historical share price chart
Net sales
329
347
371
437
600
250
% chg
(5.9)
5.6
6.8
17.7
37.3
Adj. Net profit
68
86
86
89
143
200
% chg
(24.0)
25.0
0.1
3.8
60.5
150
EBITDA margin (%)
40.7
38.5
37.1
35.5
37.0
100
EPS (`)
4.8
6.0
6.0
6.2
10.0
P/E (x)
40.2
32.2
32.2
31.0
19.3
50
P/BV (x)
3.7
2.1
2.0
1.9
1.7
0
RoE (%)
9.1
6.6
6.2
6.1
8.9
RoCE (%)
9.1
6.6
6.5
7.0
9.8
EV/Sales (x)
10.0
8.5
8.5
7.2
5.2
Source: Company, Angel Research
EV/EBITDA (x)
24.7
22.0
23.0
20.2
14.1
Source: Company, Angel Research Note: CMP as of January 24, 2018
Amarjeet S Maurya
022-40003600 Ext: 6831
Please refer to important disclosures at the end of this report
1
Navkar Corporation | 3QFY2018 Result Update
Exhibit 1: 3QFY2018 Performance
Y/E March (` cr)
3QFY18 3QFY17
% yoy 2QFY18
% qoq 9MFY18 9MFY17
% chg
Net Sales
106
92
16.2
108
(1.2)
313
272
15.2
Staff Costs
9
9
1.0
9
2.6
26
24
9.7
(% of Sales)
8.4
9.7
(127)
8.1
31
8.4
8.8
(42)
Other Expenses
60
49
21.3
59
2.1
170
145
16.8
(% of Sales)
56.3
53.9
233
54.4
187
54.3
53.5
75
Total Expenditure
69
58
18.2
67
2.2
196
169
15.8
Operating Profit
38
33
12.8
40
(7.0)
117
103
14.2
OPM
35.3
36.4
37.5
37.4
37.7
Interest
1
9
(84.7)
5
(75.3)
14
24
(41.2)
Depreciation
5
5
(1.0)
5
(1.0)
16
15
5.7
Other Income
0
2
(82.7)
0
(13.3)
2
10
(78.8)
PBT (excl. Ext Items)
31
22
44.4
30
4.0
89
73
21.1
Ext (Income)/Expense
-
-
-
-
PBT (incl. Ext Items)
31
22
44.4
30
4.0
89
73
21.1
(% of Sales)
29.4
23.7
27.9
28.4
27.0
Provision for Taxation
8
2
5
19
8
134.9
(% of PBT)
25.0
10.3
17.6
21.3
11.0
Reported PAT
23
19
20.7
25
(5.4)
70
65
7.0
PATM
22.0
21.2
23.0
22.4
24.0
Minority Interest After
NP
Extra-ordinary Items
Reported PAT
23
19
20.7
24.8
(5.4)
70
65
7.0
PATM
22.0
21.2
23.0
22.4
24.0
Source: Company, Angel Research
January 24, 2018
2
Navkar Corporation | 3QFY2018 Result Update
Outlook and Valuation
Going forward, we expect Navkar’s utilizations to improve; we expect the company
to be able to garner a good chunk of business over the next 2-3 due to its rail
advantage at both JNPT and Vapi. We maintain our Buy recommendation on the
stock with a target price of `265.
Downside risks to our estimates include
The company is exposed to currency risk with foreign currency debt of `194cr
on its balance sheet (as of 31-03-2015). The company uses dollar call options
to hedge against dollar appreciation and as per the term, the foreign currency
debt will get converted to INR debt upon dollar rate hitting the strike price. In
this event, the interest rate on the INR debt will be at ~12%.
Currently the company is paying lower taxes, with it getting tax benefits for its
CFS operations. Once the exemption period is over, the company will have to
pay higher taxes, which could impact its earnings growth.
Delay in capacity expansion and lower than expected utilization of existing
CFS as well as existing players increasing their capacity at JNPT could impact
the profitability of the company. Delay in capacity enhancement at JNPT can
also impact the top-line.
The company operates a PFT at JNPT which has helped the company in
increasing its volumes. Lapse in agreement with the Indian Railways will lead
to the company being unable to operate its PFT.
January 24, 2018
3
Navkar Corporation | 3QFY2018 Result Update
Company Background
Navkar is a CFS operator with three CFSs, Ajivali CFS I and Ajivali CFS II at Ajivali
and one at Somathane. All of its CFS units are strategically located in close
proximity to JNPT which is the largest container port in India. As of May 31, 2015,
Navkar’s CFSs had an aggregate installed handling capacity of 310,000 TEUs per
annum. It has a PFT which facilitates loading and unloading of cargo from
container trains operating between Somathane CFS and JNPT and to transport
domestic cargo to and from inland destinations on the Indian rail network. As of
May 31, 2015, it also owns and operates 516 trailers for the transportation of
cargo between its CFSs and the JN Port by road. The company offers services like
cargo storage facilities at CFSs, packing, labeling/bar-coding, palletizing,
fumigation and other related activities. It also provides warehousing facilities, for
which, it occupies an aggregate area of 500,000 sq ft.
Exhibit 2: CFS details
Particulars
Ajivali CFS I
Ajivali CFS II
Somathane CFS
Somathane/Ashte
Location
Ajivali village, Panvel Ajivali village, Panvel
village, Panvel
Area Custom Notified
135,156 sq. ft.
428,400 sq. ft.
1,073,224.35 sq. ft.
Operational since
May 12, 2008
May 18, 2006
May 11, 2009
Installed Capacity per
25,000 TEUs
65,000 TEUs
220,000 TEUs
annum
Bonded warehouse
-
27,641 sq. feet
33,141 sq. feet
Reefer Points
16
24
52
Temperature controlled
-
500 m
-
chambers
Authorized to handle,
Authorized to handle,
store and deliver
store and deliver
Hazardous cargo
-
hazardous cargo up to
hazardous cargo, up
the total installed
to the total installed
capacity per annum capacity per annum
Connectivity
Road
Road
Rail and road
Source: Company, Angel Research
January 24, 2018
4
Navkar Corporation | 3QFY2018 Result Update
Consolidated Profit & Loss Statement
Y/E March (` cr)
FY2015
FY2016
FY2017
FY2018E FY2019E
Total operating income
329
347
371
437
600
% chg
(5.9)
5.6
6.8
17.7
37.3
Total Expenditure
195
214
233
282
378
Operating Expenses
138
-
-
-
-
Purchases of Traded Goods
-
-
-
-
-
Personnel Expenses
22
25
32
39
54
Others Expenses
34
189
202
242
324
EBITDA
134
134
137
155
222
% chg
7.9
(0.1)
2.8
12.8
43.2
(% of Net Sales)
40.7
38.5
37.1
35.5
37.0
Depreciation& Amortisation
15
19
20
23
25
EBIT
119
114
117
132
197
% chg
6.8
(3.6)
2.6
12.4
49.3
(% of Net Sales)
36.1
32.9
31.6
30.2
32.8
Interest & other Charges
26
34
31
34
33
Other Income
2
23
13
14
14
(% of PBT)
2.3
22.5
13.2
12.2
7.9
Share in profit of Associates
-
-
-
-
-
Recurring PBT
94
103
99
111
178
% chg
15.3
9.3
(3.8)
11.9
60.5
Prior Period & Extraordinary Expense/(Inc.)
-
-
PBT (reported)
94
103
99
111
178
Tax
12
18
14
22
36
(% of PBT)
12.4
17.1
13.7
20.0
20.0
PAT (reported)
83
86
86
89
143
Extraordinary Items
(14)
-
-
-
-
ADJ. PAT
68
86
86
89
143
% chg
(24.0)
25.0
0.1
3.8
60.5
(% of Net Sales)
20.8
24.6
23.1
20.3
23.8
Basic EPS (`)
4.8
6.0
6.0
6.2
10.0
Fully Diluted EPS (`)
4.8
6.0
6.0
6.2
10.0
% chg
(24.0)
25.0
0.1
3.8
60.5
January 24, 2018
5
Navkar Corporation | 3QFY2018 Result Update
Consolidated Balance Sheet
Y/E March (` cr)
FY2015
FY2016
FY2017
FY2018E FY2019E
SOURCES OF FUNDS
Equity Share Capital
112
145
145
145
146
Reserves& Surplus
638
1,144
1,229
1,318
1,461
Shareholders’ Funds
750
1,289
1,374
1,463
1,607
Minority Interest
-
-
-
-
-
Total Loans
555
452
440
420
400
Deferred Tax Liability
33
33
33
33
33
Total Liabilities
1,338
1,773
1,847
1,916
2,039
APPLICATION OF FUNDS
Gross Block
1,133
1,256
1,529
1,549
1,569
Less: Acc. Depreciation
59
79
100
123
148
Net Block
1,073
1,177
1,429
1,426
1,421
Capital Work-in-Progress
27
27
27
27
27
Investments
5
-
-
-
-
Current Assets
253
574
390
464
601
Inventories
2
2
3
4
5
Sundry Debtors
77
83
89
105
145
Cash
1
262
26
45
26
Loans & Advances
48
52
67
79
108
Other Assets
126
175
204
231
318
Current liabilities
22
24
18
20
30
Net Current Assets
231
551
372
444
571
Deferred Tax Asset
1
1
1
1
1
Mis. Exp. not written off
-
-
-
-
-
Total Assets
1,338
1,773
1,847
1,916
2,039
January 24, 2018
6
Navkar Corporation | 3QFY2018 Result Update
Consolidated Cashflow Statement
Y/E March (` cr)
FY2015
FY2016
FY2017
FY2018E FY2019E
Profit before tax
80
103
99
111
178
Depreciation
15
19
20
23
25
Change in Working Capital
7
(58)
(57)
(53)
(147)
Interest / Dividend (Net)
26
34
31
34
33
Direct taxes paid
(22)
(18)
(14)
(22)
(36)
Others
18
-
-
-
-
Cash Flow from Operations
123
81
80
93
53
(Inc.)/ Dec. in Fixed Assets
(209)
(123)
(273)
(20)
(20)
(Inc.)/ Dec. in Investments
15
5
-
-
-
Cash Flow from Investing
(194)
(118)
(273)
(20)
(20)
Issue of Equity
-
453
-
-
-
Inc./(Dec.) in loans
97
(103)
(12)
(20)
(20)
Dividend Paid (Incl. Tax)
-
-
-
-
-
Interest / Dividend (Net)
(27)
402
(31)
(34)
(33)
Cash Flow from Financing
71
298
(43)
(54)
(53)
Inc./(Dec.) in Cash
0
261
(236)
19
(20)
Opening Cash balances
1
1
262
26
45
Closing Cash balances
1
262
26
45
26
January 24, 2018
7
Navkar Corporation | 3QFY2018 Result Update
Key Ratios
Y/E March
FY2015
FY2016
FY2017
FY2018E FY2019E
Valuation Ratio (x)
P/E (on FDEPS)
40.2
32.2
32.2
31.0
19.3
P/CEPS
28.1
26.3
26.0
24.6
16.4
P/BV
3.7
2.1
2.0
1.9
1.7
Dividend yield (%)
0.0
0.0
0.0
0.0
0.0
EV/Sales
10.0
8.5
8.5
7.2
5.2
EV/EBITDA
24.7
22.0
23.0
20.2
14.1
EV / Total Assets
2.4
1.7
1.7
1.6
1.5
Per Share Data (`)
EPS (Basic)
4.8
6.0
6.0
6.2
10.0
EPS (fully diluted)
4.8
6.0
6.0
6.2
10.0
Cash EPS
6.9
7.4
7.4
7.8
11.7
DPS
0.0
0.0
0.0
0.0
0.0
Book Value
52.6
90.4
96.4
102.6
112.7
Returns (%)
ROCE
9.1
6.6
6.5
7.0
9.8
Angel ROIC (Pre-tax)
9.1
7.7
6.6
7.2
9.9
ROE
9.1
6.6
6.2
6.1
8.9
Turnover ratios (x)
Asset Turnover (Gross Block)
0.3
0.3
0.2
0.3
0.4
Inventory / Sales (days)
2
2
3
3
3
Receivables (days)
86
87
88
88
88
Payables (days)
7
5
4
4
4
Wc cycle (ex-cash) (days)
81
84
87
87
87
January 24, 2018
8
Navkar Corporation | 3QFY2018 Result Update
Research Team Tel: 022 - 39357800
DISCLAIMER
This document is solely for the personal information of the recipient, and must not be singularly used as the basis of any investment
decision. Nothing in this document should be construed as investment or financial advice. Each recipient of this document should
make such investigations as they deem necessary to arrive at an independent evaluation of an investment in the securities of the
companies referred to in this document (including the merits and risks involved), and should consult their own advisors to determine
the merits and risks of such an investment.
Angel Broking Pvt. Limited, its affiliates, directors, its proprietary trading and investment businesses may, from time to time, make
investment decisions that are inconsistent with or contradictory to the recommendations expressed herein. The views contained in this
document are those of the analyst, and the company may or may not subscribe to all the views expressed within.
Reports based on technical and derivative analysis center on studying charts of a stock's price movement, outstanding positions and
trading volume, as opposed to focusing on a company's fundamentals and, as such, may not match with a report on a company's
fundamentals.
The information in this document has been printed on the basis of publicly available information, internal data and other reliable
sources believed to be true, but we do not represent that it is accurate or complete and it should not be relied on as such, as this
document is for general guidance only. Angel Broking Pvt. Limited or any of its affiliates/ group companies shall not be in any way
responsible for any loss or damage that may arise to any person from any inadvertent error in the information contained in this report.
Angel Broking Pvt. Limited has not independently verified all the information contained within this document. Accordingly, we cannot
testify, nor make any representation or warranty, express or implied, to the accuracy, contents or data contained within this document.
While Angel Broking Pvt. Limited endeavours to update on a reasonable basis the information discussed in this material, there may be
regulatory, compliance, or other reasons that prevent us from doing so.
This document is being supplied to you solely for your information, and its contents, information or data may not be reproduced,
redistributed or passed on, directly or indirectly.
Angel Broking Pvt. Limited and its affiliates may seek to provide or have engaged in providing corporate finance, investment banking
or other advisory services in a merger or specific transaction to the companies referred to in this report, as on the date of this report or
in the past.
Neither Angel Broking Pvt. Limited, nor its directors, employees or affiliates shall be liable for any loss or damage that may arise from
or in connection with the use of this information.
Note: Please refer to the important `Stock Holding Disclosure' report on the Angel website (Research Section). Also, please refer to the
latest update on respective stocks for the disclosure status in respect of those stocks. Angel Broking Pvt. Limited and its affiliates may
have investment positions in the stocks recommended in this report.
Disclosure of Interest Statement
Navkar Corporation
1. Analyst ownership of the stock
No
2. Angel and its Group companies ownership of the stock
No
3. Angel and its Group companies' Directors ownership of the stock
No
4. Broking relationship with company covered
No
Note: We have not considered any Exposure below ` 1 lakh for Angel, its Group companies and Directors
Ratings (Returns):
Buy (> 15%)
Accumulate (5% to 15%)
Neutral (-5 to 5%)
Reduce (-5% to -15%)
Sell (< -15%)
January 24, 2018
9